Analytics & Business Intelligence

Transform your data into actionable information across the platform

Harness the Power of Your Data

Empower your team with our visual analytics platform to transform data into actionable insights for informed decision-making and problem-solving

Measure Performance

Measure Performance

On-demand and automated reports measure performance and productivity across groups, locations, users, referral partners, etc. based on customer-defined targets

Improve Processes

Improve Processes

On-demand and automated reports identify workflow patterns allowing your team to determine if custom-defined workflows or processes need refinement

Identify Trends

Identify Trends

On-demand and automated reports uncover trends related to consults, referrals, referral partners, users, etc. allowing your team to take action quickly when needed

Our analytics and reports allow your organization to measure performance, improve processes, identify trends, and uncover risks across the platform including Consults, Referrals, Appointments, Marketing CRM, etc.

Our analytics and reports allow your organization to measure performance, improve processes, identify trends, and uncover risks across the platform including Consults, Referrals, Appointments, Marketing CRM, etc.

  • ReferralMD reports are powerful yet easy to use with drill-down capability and the ability to print or export on demand.

  • Reports are based on real-time data so users can run reports at any time for any date range.

  • Reports include built-in visualizations such as trends, graphs, maps and charts.

  • Users can customize reports such as columns, sorting and the ability to apply multiple search criteria and filters per report. All report customizations by users are automatically saved and available the next time the users access their reports.

  • Reports can be exported as spreadsheets, sent automatically to designated users using a pre-defined frequency or sent as automated data feeds to your Data Warehouse or BI Tool.

Dashboard

Dashboard

  • The real-time Dashboard provides a summary of your key metrics on one page with the ability to drill down into specific reports for more details.

  • Metrics include New Consult/Referral Partners, New Patients, Consults/Referrals Received, Consults/Referrals Sent, Profile Views, Network Leakage, Top Sending Providers, Top Receiving Providers, Consults/Referral Trends, and Current Consults/Referral Status Summary.

Automated Reports

Automated Reports

  • You can customize Automated Reports by defining Objectives along with the Frequency, Regions, Plan Types, and Account Recipients. The Account Recipients will receive the Automated Reports via email based on the selected Frequency.

  • Objectives can be defined across report categories such as Appointments, Process Time, Productivity, Top Providers, Top Reasons, and Volume.

  • Targets can be defined across Objectives indicating the target value for each objective such as a target of less than 10% for leakage or a time of less than 3 hours for processing STAT consults/referrals.

  • You can view a history of all the Automated Reports generated and the recipients who received the reports.

Trends

Trends

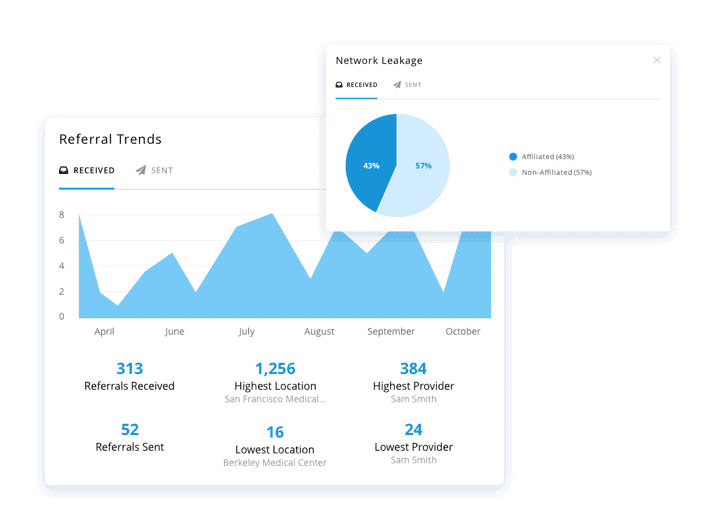
  • The Consult/Referral Trends reports show the total number of inbound consults/referrals or outbound consults/referrals displayed over time.

  • You can change the view of the trends chart by selecting Hour, Day, Week, or Month.

  • The report includes stacked columns over time showing the total number of consults/referrals broken down by the number of Not Processed, Processed, and Sent consults/referrals.

  • The Summary section shows the total number of consults/referrals received or sent, the location with the most consults/referrals, the location with the fewest consults/referrals, the provider with the most consults/referrals, and the provider with the fewest consults/referrals.

Volume

Volume

  • The Consult/Referral Volume reports show the total number of consults/referrals per row based on the Primary Grouping and Secondary Grouping selected in the report.

  • You can customize the Primary and Secondary groupings in the report by using the drop-down in each column. You can also customize the standard filters and date range at the top of the report.

Distribution Map

Distribution Map

  • The Consult/Referral Map reports show the distribution of consults/referrals geographically by postal code. The maps in the report can be zoomed in or zoomed out as needed.

  • If you click a pin on the map, the system will display the total number of consults/referrals received from or sent to the selected postal code.

  • If you click the postal code total for the pin, you will see a list of the providers in that postal code along with the total number of consults/referrals per provider.

Activity Analysis (Productivity)

Activity Analysis (Productivity)

  • The Consult/Referral Activity reports display consults/referrals with at least one logged activity (task, note, call, email, text, meeting, etc.)

  • You can customize the Primary and Secondary groupings in the report by using the drop-down in each column.

  • The report includes total counts for Touchpoints and Consults/Referrals and One Touch Resolution Metrics along with Duration Metrics showing how long it takes for consults/referrals to advance between milestones in the workflow.

Process Time (Productivity)

Process Time (Productivity)

  • The Process Time report shows how long it takes to process consults/referrals throughout the entire workflow process. The report includes all the standard and customized phases in the workflow and the average time consults/referrals stay in each phase.

  • Some of the calculations in the Process Time report include Average Time, First Change (outbound), First Change (inbound), Send Time, Accept Time, Schedule Time, Wait Time, Report Time, and more.

Leakage Rate

Leakage Rate

  • The Network Integrity report compares total referral volume over time with the percentage of referrals received from or sent to Out-Of-Network providers (leaked referrals). The referral volume is measured on the left axis and the leakage rate is measured on the right axis.

  • The Network Integrity section shows the percentage of inbound referrals received from or outbound referrals sent to In-Network and Out-Of-Network providers based on the Network Tiers defined in your account.

  • The Top Providers section lists the top referring providers across inbound referrals and top receiving providers across outbound referrals and the average percentage of referrals per provider that were out of network.

No Show Rate

No Show Rate

  • The Communications report shows a summary of the communications exchanged with patients along with response rates and no-show rates.

  • The report shows the totals and the trends over time across metrics.

  • Metrics in the report include Appointment Counts, Patient Opt-Out Methods, Messages Sent, Messages Received, Patient Response Types, Confirmed Appointments, Canceled Appointments, Total No-Shows, and Confirmed No-Shows (patient no-shows out of the total number of appointments with patient confirmations.)

Automated Data Exports

  • Automatically send data exports to your Data Warehouse or BI Tool using flat files or APIs based on data elements defined by the customer.

And Many Other Reports...

Solve Your Interoperability Challenge

We integrate with most electronic health records (EHR) systems, practice management systems (PMS), and radiology information systems (RIS) with APIs, HL7, FHIR, or Direct.

Request a Demo

See how ReferralMD delivers a better experience for providers, staff, and patients.

Learn More