At this point we have all been exposed to numerous reporting and analytics solutions, it is becoming a data overload. What does all of this data mean? Without context, without goals, and without direction this data is only a gathering of numbers. Connecting the data to goals, understanding the workflow to obtain the data, and more importantly coming up with a cohesive reporting structure can help remove the data burden on your organization.
Outlined below are 5 steps that you can use to begin making sense out of your unconnected data:
1. Reporting current data in relation to past data
Data on its own doesn’t mean much to a user at any stage of the reform process. The key to understanding data is comparing with another source of data. In many industries, including healthcare, this means comparing to the past data that you have collected. This process may frustrate many people because it is not instantaneous; however, it is worth the wait because this will be the source of decision-making quality information.
Relationships between the past and present show you improvements, but more importantly they show declines in performance. Often, understanding why a portion of your business was doing well but is no longer fulfilling goals will lead to an increase in repeat business. It is this reason that comparisons between current and past occurrences is so significant.
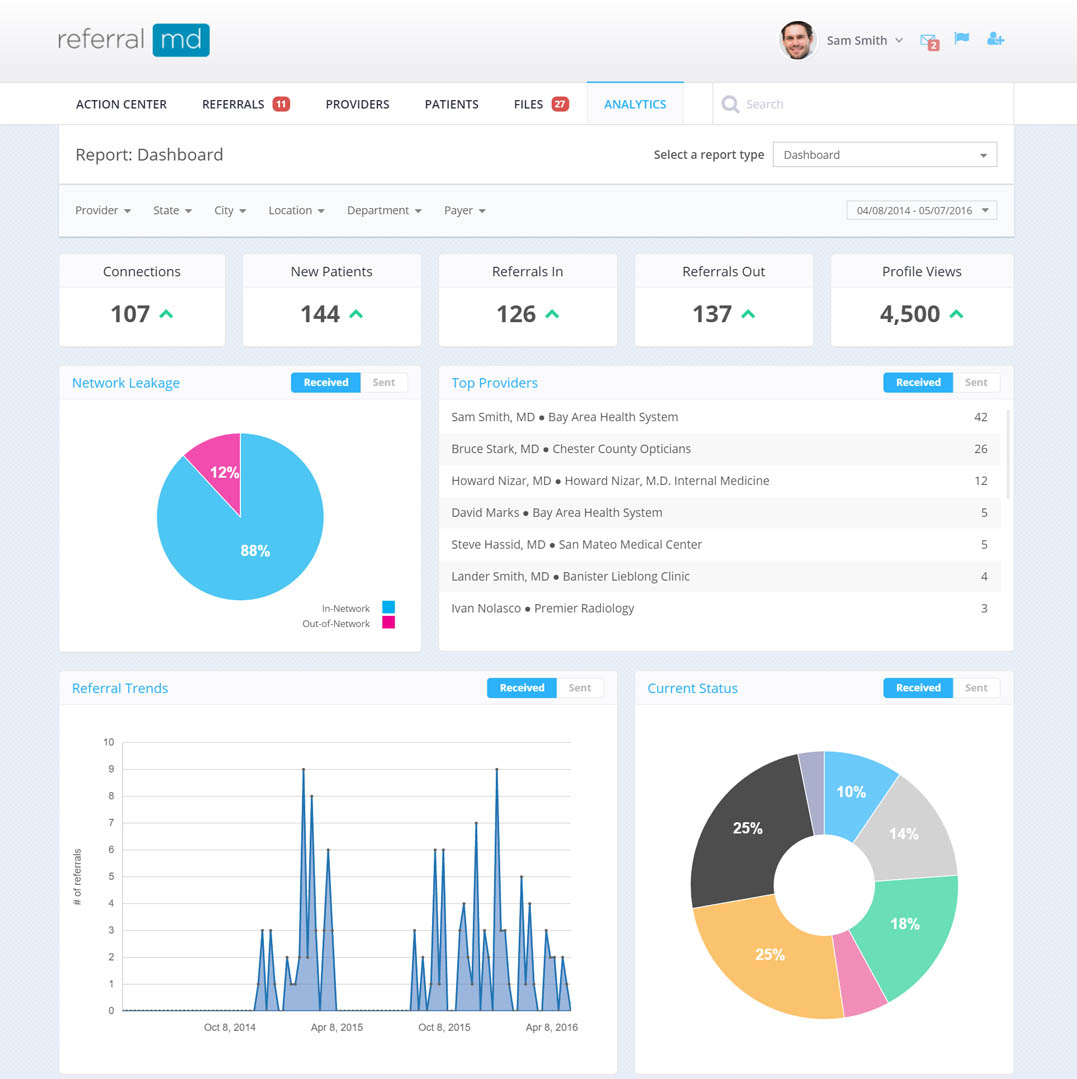
Learn more about how to track patient referral leakage with referralMD’s robust reporting package.
Past data views allow for the discovery of anomalous events that may drive business away, or may be preventing business from recurring. Some examples of abnormal events in the referral marketplace as follows:
1. You regularly receive 10 referrals a month from Debbie Blank, M.D., the owner of a 4 physician practice called Rio Grande Primary Care. Last month you only got 2 referrals, and this month you have received none.
- We can determine that there must be a problem, either with our services or with that office. From here we can make a decision to either call, email, or try to engage the client in a different way.
- In this case Rio Grande Primary care lost the employee responsible for sending referrals. The new staff member is not familiar with the system and is now sending referrals via fax to different specialists. Retraining the new employee has resulted in a continuation of services.
2. You generally receive 80 referrals a month from different primary care doctors to your nursing and home care facility, Prima One Home Care and Nursing. Last month your seemingly steady influx of 80 referrals dropped to 20.
- As above, any drop in a normal pattern should be a cause for concern. If the singular referrals (the ones that come in from a large number of separate locations) drop suddenly a reason must exist that links them.
- In this case, we find out that another facility recently began a marketing campaign offering rewards to those who referred to their facility. A counter-plan may be necessary.
- This drop could also, among many other possibilities, be attributed to a grouping of seemingly unconnected providers. Maybe they belong to the same network, or are part of a different grouping. Identifying these traits, particularly the ones that you do not know exist, will be necessary for the longevity of any prosperous business.
Referencing older data is the only way to establish a proper baseline for reporting. Again, reporting numbers never means anything to decision makers unless that number is tied to a different number. In the case of analytics, these figures are usually data from the past or an industry standard.
2. Compare your data vs. industry averages
This comparative metric is as, if not more, important than understanding your data in comparison with your past data. An analytics platform that achieves industry scaling is more valuable than one that does not. The reason for the importance of scaling is that you must establish baselines with your data before you can consider it useful. If you do not have a starting point you will remain unaware of improvements or deficiencies within your operation.
As a live use case we can look at the referral management market space using referralMD’s analytics engine. Let’s assume that we are an established practice with access to industry averages (unidentified averages). We can collect our data for a period, in this case one month should do, and then compare it to those averages. We can link data from one aspect of our referral business to another by:
- Define critical data roles and correlations
- Our statistics show business loss, so we look at our general metrics vs. industry averages
- Our statistics show an increase in business within a location, so we look at comparative statistics from that location
- We compare rises in averages with our business performance
- Set expectations and understand the value of intra-business relationships
- Know what your expected turnaround time is on document requests
- Know what your expected response rate to a referral is
- Know what your expected “clean” process of communication requires
Once a set of expected values is established and recently acquired data in available you can begin to make better business decisions. When compared to industry averages you can see which of your core components is lacking, and then you can take the proper steps to correct the actions.
Hypothetical Case Use:
The Women and Children’s Hospital of Buffalo New York likely collects information important to retention and acquisition of patients. In the case of this medical center these patients are often expecting mothers and children. They likely already know how many OBGYNs are members of their hospital and use their facilities. In line with what they know about these providers they likely know how many patients use the facilities at the provider’s direction.
What the hospital may not know, is what percentage of revenue is driven to the hospital by referrals made by urgent care clinics, non-network providers, and pediatric primary care givers. Referral sources in many cases are coming from word-of-mouth and a phone call.

The Women and Children’s hospital of Buffalo regularly receives referrals from out-of-network sources
Actual Scenario:
An infant is taken to a pediatric urgent care clinic at 8 p.m. presenting with a mild case of jaundice. After being seen the patient is directed to the Women and Children’s Hospital, the care provider places a call to the pediatric unit and advises of the arrival. The patient ends up being checked in for a 4 night stay at the hospital, mother and child.
What the hospital is missing:
Because the hospital has not instituted a standard of referral into these units they cannot collect data on the true frequency of occurrence. Because of this lack of data they will be unable to assign true values to these referrals. Without a true value an opportunity to greatly expand reach may be missed. With a data collection and aggregation process in place the hospital can identify gaps in provider reach and establish procedures to either correct or continue with a course of action.
How it can be fixed:
In addition to understanding their own metrics the ability to understand industry averages will help identify common-use practices that have led to successes and failures in other locations. In the case of Women and Children’s Hospital of Buffalo this may mean that before an urgent care referral is ever taken they can identify that a system needs to be in place to monitor the referrals.
With industry-wide monitoring the hospital can understand industry-specific problems before they become a detriment to the implemented care system at the hospital. Comparative data will be used here to:
- Gain insight into the hospital’s own inbound referral network
- Identify gaps in monitoring based on industry standards
- See if an above-average industry standard is being underutilized
- Formulate plans based on industry average data
- Compare self data with that of peer groups to begin base-lining current standardization practices.
Data leads to better care
The collection of this data will show that this healthcare facility needs to create a better outreach program for clinics or practices that may refer into the facility using non-standard practices. The urgent care clinic referenced above may send a large portion of critical patients to Women and Children’s Hospital. If the hospital implemented a easy-to-use referral process they can begin to collect data, streamline the care coordination process (get documents from that urgent care clinic), and increase the likelihood that referrals will increase in volume from that location, thereby reducing referral leakage.
Data by itself will never make your business better, it is the fact that data can show you deficiencies in your process that brings value to an analytics solution. Looking at beautiful charts and graphs may give you a good feeling when you see large numbers, but it is truly understanding how those numbers impact business that is important.
3. Analyze your referral network
The health of your referral network, in the case of these examples, is the entire purpose of using an analytics engine to drive change. Once the above steps are understood and outlined for your purposes, you must then begin to monitor your referral network. This step uses the tools that we have already discussed, only put into the context of your referral network. System health is not always depicted through the analytics as they lay, first you must contextualize the sources of referrals that bring you the most business. Within the healthcare industry, and referral management specifically, you must understand where success originates.
A specialist may attract referrals from a particular type of physician, or in the case of larger health systems and specialty care practices a significant portion of inbound business may come from a small number of high-volume referrers. As an example, if you are the best cardiologist in the country, you may find that you are receiving the majority of your referrals from other large healthcare institutions. If you are a highly regarded urologist within a local area you may find that most of your referrals come from local physicians.
Understanding the source of referral strength will be necessary when determining how to find, use, and keep sources. Unexploited channels of revenue may exist; however, without a clear indication of network strength and the resources that power that strength and analysis may be uneventful.
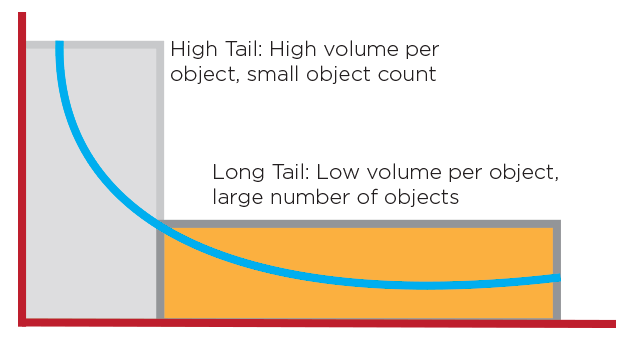
As with marketing, understanding high-tail and long-tail principles will come into play, although these are standard terms in the marketing industry, they are not commonly applied to other analytical environments.
Definitions:
High-Tail: Depending on which statistical governance you decide to abide by, the general rule is that 80% of monitored events occur in the first 20% of a population metric. In healthcare this could mean that the majority of your business (80%) being referred in is only using a small portion of your output potential (20%).
Long-Tail: This is the remaining 20% of monitored events; however, the population of events contained within this portion of the chart can often outweigh the value of the high-tail component.
What does this mean to me?
This means that you may believe your business is being supported entirely by one or two components. In the case of a large academic medical center 80% of the procedures being performed are either hip replacement surgeries or stent placements (high volume). Your practice offers almost 40 other procedures but does not perform any one or two of those procedures as much as your high tail items.
The remaining 20% of procedures offered may drive more value when grouped together by population totals. If you examine the total output of a business you often find that a large population may each buy different items, making up more total revenue than the small percentage of the population that all purchases the same items.
Understanding this data can lead to better marketing efforts, a more well-rounded business plan, and countless other benefits. Your specific business may not be impacted by long-tail; however, you may also be forgetting about the population total that brings in the largest amount of revenue. Understanding and reporting these metrics is necessary if you want to get the most out of any analytics expense. Without them, your may be missing one of the core competencies of a well-designed analytics solution.
How can I track my results with my network?
We recommend using technology such as referralMD, to help monitor and manage your network of referring providers and improve communication between both offices. It includes an online network of your peers, direct messaging, referral life-cycle management tools, and file exchange between organizations. Very powerful tool for ACO’s and Hospitals.
4. Determine, and then monitor your niche market
As with any other data gathering project you must start with a baseline. If you are starting fresh from an analytics perspective it is mandatory to determine what it is that you want to report on, plan that out, and then watch. A baseline in the case of your target market will help you understand how you must adjust your current practices.
A variety of different market factors may need to be monitored in relation to time to determine how to repair or grow your practice. Specialty, geographic location, and relationship management are good places to start when determining a baseline of your analytic health in relation to a niche market. Not all specialties, practices, hospitals, or health systems will need to monitor a niche – some of these will be either too broad or too specific to make use of niche monitoring.
A niche does not have to mean that you only offer one service, an expanded view of niche understanding must be taken when viewing data from an analytics perspective. Your niche might be that you cultivate relationships with home healthcare providers. Your niche may also be that you primarily perform urology services for the ultra-elite. Ultimately, you may think you know what your niche is, but for the majority of the healthcare provider population this remains a mystery.
You can unlock this mystery and begin to understand how the services you provide interact with other providers, regions and locations, and health systems. Once you know your actual niche you can start to develop a better relationship management plan. This relationship management strategy can help retain customers, grow user bases, and even result in better care coordination.
Example:
Dr. Rahban is a plastic surgeon is Beverly Hills, and although he offers a variety of plastic surgery procedures, one of his most well-known niches is the rhinoplasty. Although we cannot know the exact number of these surgeries he performs, or the amount of adjusted revenue he earns from these surgeries in comparison to others, it is easy to see that he is carving a niche for this service.
Simply performing a search for ‘best nose job’ turns up his website in the top 5 results. He has taken data, found a niche, and is using the power of niche presence to drive revenue generating decisions. Although over services are provided, if he has identified this as his highest-return procedure he can focus primary attention on this to create a working backbone of his practice. Focus creates sustainable results, as long as the quality of care matches the effort put into that focus.
Through the use of data collection, monitoring, and reporting Dr. Rahban is able to make better business decisions, ones that he knows will return on any investment. The idea behind understanding how your available niche choices are affecting, and will eventually affect you, is that you can make decisions that support your most profitable market segments. With this knowledge propitious decision-making becomes natural.
Once a monitoring system is implemented, a determination can be made quickly in the event of a rise or decline in activity. As mentioned previously, if your niche is that your referrals come primarily from home healthcare services, and you notice a steep decline in referrals from that source, you can be made aware. Once made aware you can begin to develop a strategy to combat further losses.
Ideally a system is implemented that catches anomalies in service before they begin to affect revenue. Without a monitoring and alerting system these declines in service may go unnoticed, a dangerous prospect for any business or practice.
Perhaps more important is the alternative scenario, in the event that a boon is realized the efforts to achieve the increase can be understood.
5. Alerting Procedures
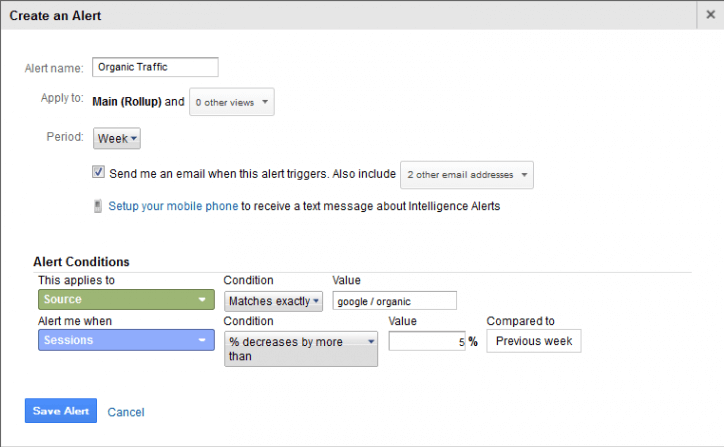
Once data correlation is understood and outlined, and the plan has been created, implementation must begin. A truly actionable analytics and reporting package generally includes an alerting function. The goal of an alerting function is to automate the process of tracking anomalous increases or decreases of a tracked item. Without an alerting function data must often be gathered from a source, imported to a finishing product, and then reported on. An alerting function skips the importation step – it removes the necessity of finishing the data output.
Proper alerting occurs through multiple data sources and sends a notice to a defined user on the event that a pre-defined action occurs.
Actionable Example:
We want to know when our referral response times drop below industry standards. We want to know this because we have worked hard to make sure that our response times and communication procedures were always functional and we believe them to be a primary cause for steady increases in inbound volume.
In our analytics platform we will set up an alerting function, and most of them operate on an If / Then statement architecture. Because this is a simple function it can be contained within one data set, the data set that contains the industry average of referral response times and our average referral response times. We would simply set an alert to send notifications to administrators when our referral response time drops below the industry average. This is an actionable item because once we know a problem exists with our referral response times we can identify the internal cause and make a correction.
A more complicated alerting function may be used to determine niche performance in comparison with industry averages based on practice type with multi-level historical views. This is useful if we are trying to determine impact of a change in procedure (marketing, association alignment, etc.). Although this is a complicated function, once automated provides valuable information in a standardized and instantly accessible report. Example automation and alerting path:
If average volume within (x(rhinoplasty)) changes more than 10% from standard (and)
Industry average volume within (x(rhinoplasty)) remains within 2% from standard (and)
Practice type = (y(plastic surgery)) (then)
Alert with report containing month over month view of trend
Take note of any changes in practice procedure and compare with trend report to adjust strategy
Automation of referral intake paths is also beneficial:
- If average volume from (a provider / location) changes more than 20% from standard over (time period) (then)
- Alert with location report covering (time period) + (historical view)
Alerting functions are becoming a standard of many analytics platforms; however they remain seldom used because a lack of information on how to properly establish guidelines. When goals are established prior the implementation of alerting, the process becomes much easier. Once a goal is understood and outlined the process of identifying the data trail that exposes the steps of the goal becomes obvious.
Refined alerting procedures ultimately expose information deemed to be constructive toward completion of a goal. Too much information reduces the dependence on reports to make informed decisions. Altering may be most useful when the information provided is constricted to the purposes of goal completion.
Something to keep in mind:
The entire purpose of data collection and the subsequent analysis of that data is to achieve a goal. Before you can achieve any goal you must first define what the goal is. In financial planning, or more specifically buying and selling investments, we want to know what the best time is to sell. We research the company, check reports, and analyze – all to achieve a goal. For some reason, in many data scenarios you are presented with good-looking graphs, and a variety of unconnected numbers. The important piece of the puzzle that many people forget is to use the data to achieve a goal.
Before you get started, set up goals, know what it is that you want to learn, and then find a solution that can show you that information. Ideally this solution would have alerting functionality, support in the form of knowledgeable customer service, and customization. Don’t get fooled by salespeople that wow you with awesome interactive charts that only beautify the data you already get.

