45 Mind Blowing Digital Health Statistics and Trends as the second installment of our 4 part Mind Blowing HIT Stats and Facts series
 While many continue to doubt digital health’s long-term economic viability, it’s no longer possible to deny its potential. The market may remain partially untapped at the moment, but digital health’s presence is quickly becoming pervasive through a progressive tapping (and zooming, pinching, and clicking) all of its own.
In this second edition of HIT Consultant’s Mind Blowing HIT Stats and Trends series, we take a deeper look at digital health and the stats behind what promises to be a deeply transformative movement for healthcare delivery—muddling market obstacles aside.
How Physicians Utilize Digital Media
- By the end of 2012, four of five physicians will use smartphones by end of 2012
- 85% of US Physicians own or use any smartphone professionally
- 62% of US physicians own a tablet in 2012 up from 31% in 2011
- 81% of physicians own an iPad
- 50% of tablet owning physicians have used their device at the point of care
- 39% of US physicians communicate online with patients via email, secure messaging, instant messaging, or online video conferencing
- Two-thirds of physicians use online video to learn and keep up to date with clinical information
- Physicians spend an average of 11 hours online for professional purposes per week
- Top 3 specialties hours spent online professionally per week:
- Hematology Oncologists – 17 hours
- Endocrinologists – 15 hours
- OB/GYNs – 13 hours
Source: Manhattan Research: Taking the Pulse US 2012
Nearly half of consumers say they would buy mobile health tech to:
12. 20% would like to monitor fitness & wellbeing
13. 18% would like to allow a physician to remotely monitor a condition
14. 11% would like to continue to monitor a previous condition
15. 88% of physicians would like patients to be able to track or monitor their health at home
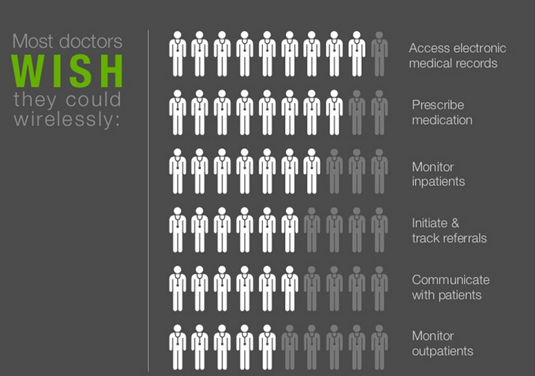
16. Most doctors wish they could wirelessly:
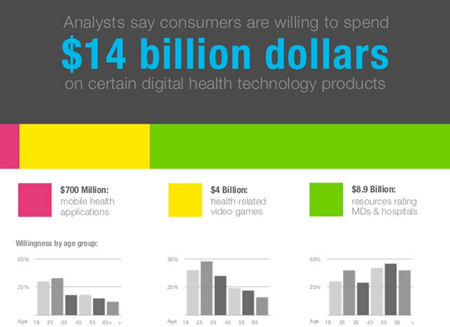
17. Consumers are willing to spend $14B on certain digital health products
18. $700 Million on mobile health applications
19. $4 Billion on health related video games
20. $8.9 Billion on resources rating MDs & hospitals
Source: Rock Health Business Models in Digital Health Consumer & Enterprise
Multi-Screen Consumption
21. According to recent study, the number of adults in the US (ages 18+) using mobile phones for health information grew from 61 million to 75 million this year, while tablet adoption nearly doubled from 15 million to 29 million.
22. 15 % of online consumers surveyed who own three devices and use at least one for a health activity
23. 60% are using all three screens to access health information.
24. Physicians with three screens (tablets, smartphones, and desktops/laptops) spend more time online on each device and go online more often during the workday than physicians with one or two screens
Source: Manhattan Research: Taking the Pulse US 2012
Patient Education
25. Results of survey healthcare extenders- non MD Healthcare professionals who work directly with and on behalf of patients to learn how they are using technology to educate patients
26. 69% use a PC for interacting with patients
27. 55% print out online materials to use with patients during a visit
28. 29% use email for communicating with patients between visits
29. 64% of healthcare extenders believe that technology has impacted the quality of interaction with patients
30. 44% deliver patient education through online video e.g. YouTube
Source: HealthEd Academy
31. 80% of Internet Users look online for health information
32. 20% search for health related content on mobile devices
33. 23% use social media to follow health experiences of friends
34. Health related Google searches are up 47% from last year
35. 81% of consumers click on a sponsored link when looking for health information
Source: Geocentric
Digital Health Startup Funding
36. From Q3 of last year, digital health VC funding has increase 70% in more money and 84% more in deals.
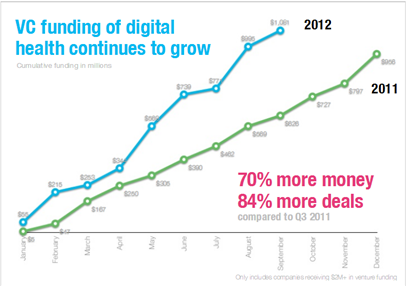
37. 103 digital health companies have each raised more than $2M in 2012 by Q3 2012
38. 10 % of digital health investors this year are new to healthcare
39. 128 VC firms invested in digital health in 2012
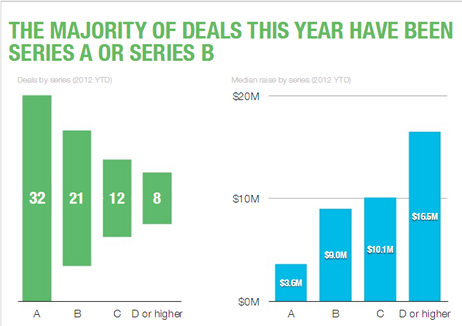
40. Majority of VC deals this year have been Series A or Series B investments
41. San Francisco & Boston represent 50% of all 2012 funding
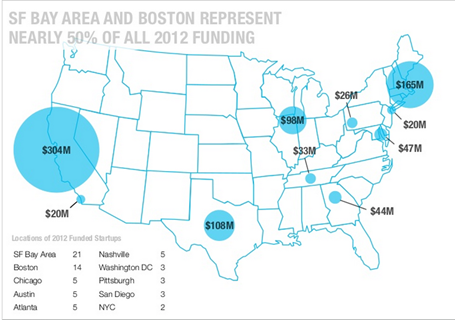
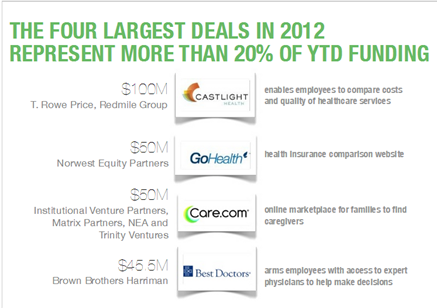
42. The four largest deals in 2012 represent more than 20% of YTD funding
43. B2B businesses remain majority of funding, B2C grows slightly in 2012
44. 77% of digital health funding went to B2B models in 2011
Source: Rock Health Digital Health Q3 2012 Funding Report
45. 90% of patients want to self-manage their healthcare leveraging technology, such as accessing medical information, refilling prescriptions and booking appointments online, but nearly half 46% are unaware if their health records are available electronically.
The survey is based on an online survey of 1,110 U.S. patients to determine the preferred channels of electronic health information and services.
Source: Accenture
The upcoming third edition will be a deep dive into mHealth & teleealth statistics and trends as we prepare for 2013.
Featured image credit: https://www.fodrizzle.com